DATA SELFIE TRIPTYCH
PRINT DESIGN
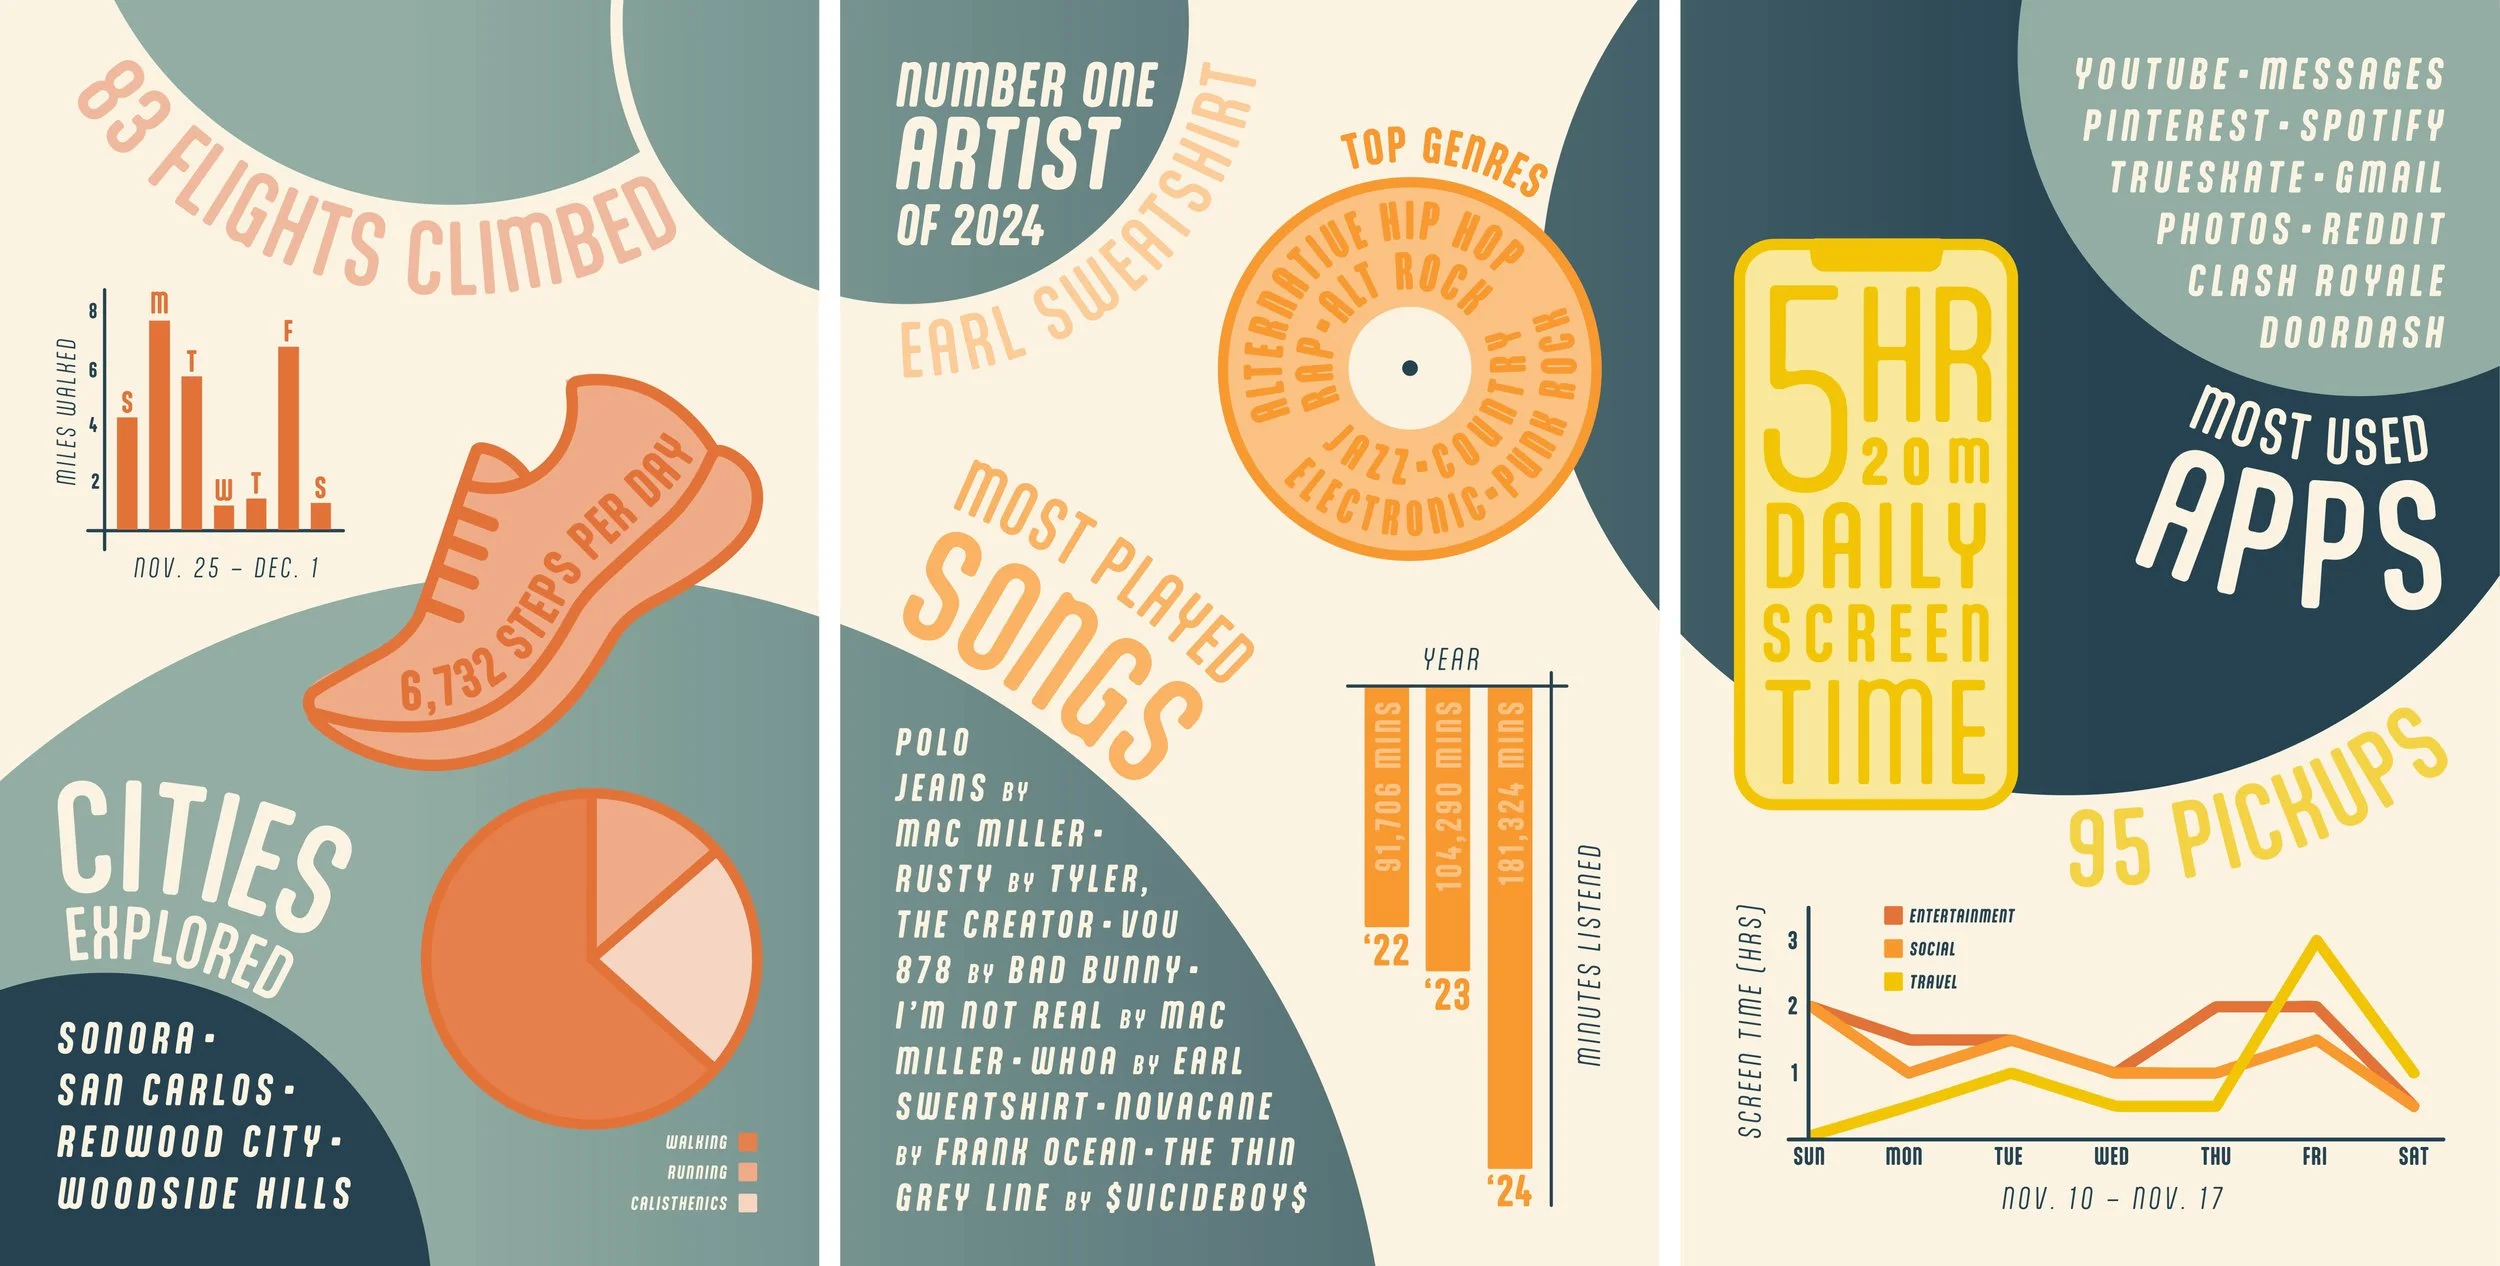
For this assignment, students were tasked with collecting data based on three personal habits and use that data to create an infographic-based triptych. I began by tracking my exercise habits, music listening habits, and cell phone habits. I moved to my sketchbook and then onto Adobe Illustrator to create a cohesive set of 11 x 17 inch posters using overlapping circles, icons and wrapped text. Each of the three posters were designed to be able to stand on their own, as well. The finished result is a bold, bright, and harmonious “Data Selfie” triptych.

SKETCHES
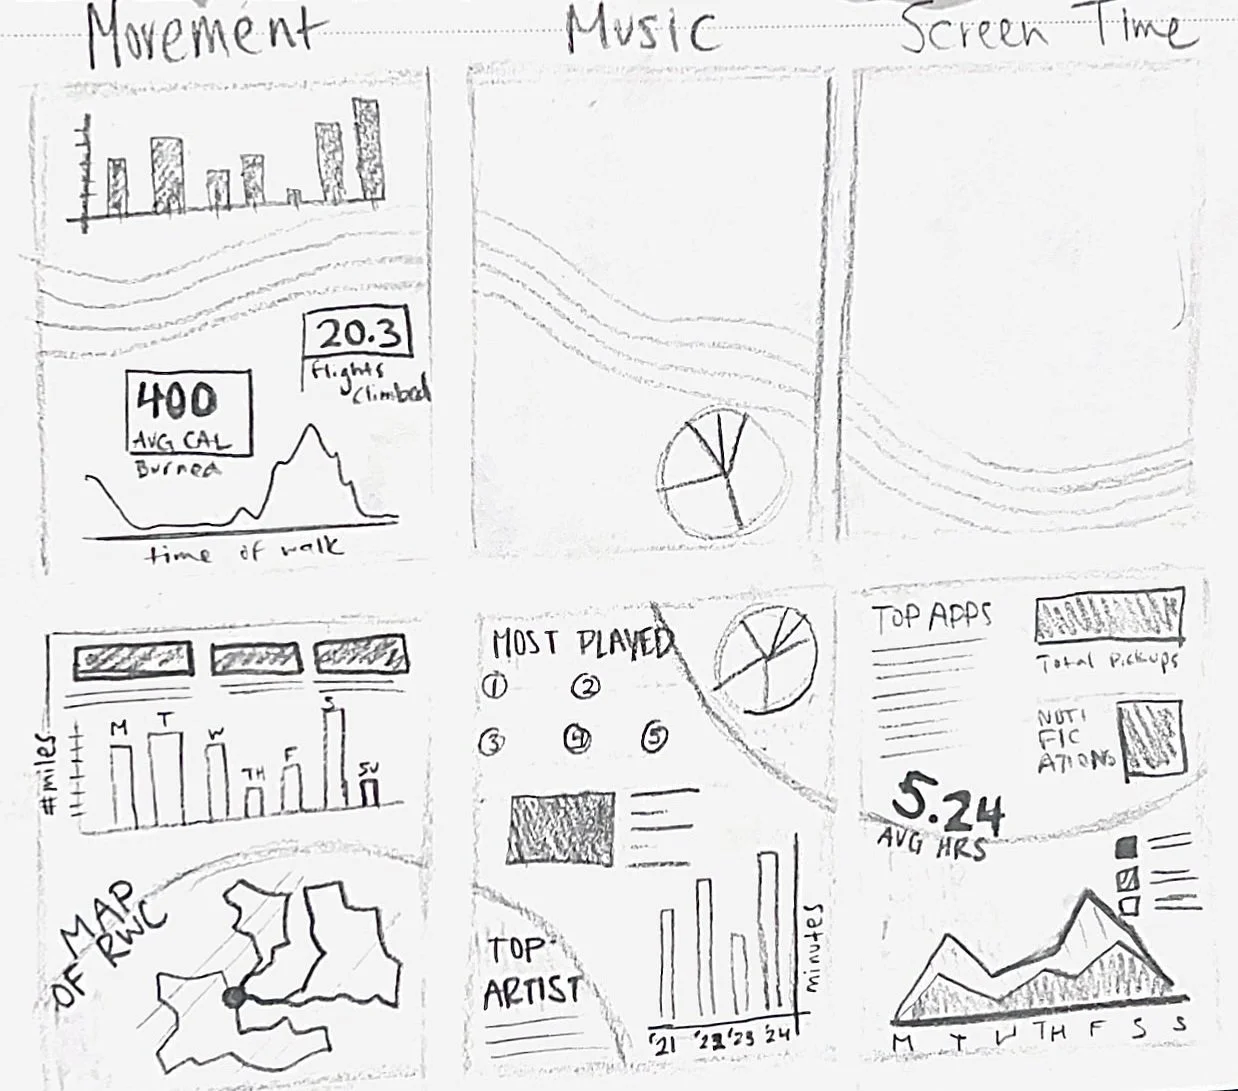
DATA

LAYOUT PROGRESSION
The first rendition lacked text hierarchy and contained some awkward white spaces that needed to be filled.

I decided to stack some text blocks to include more data and create appropriate spaces for the graphs.

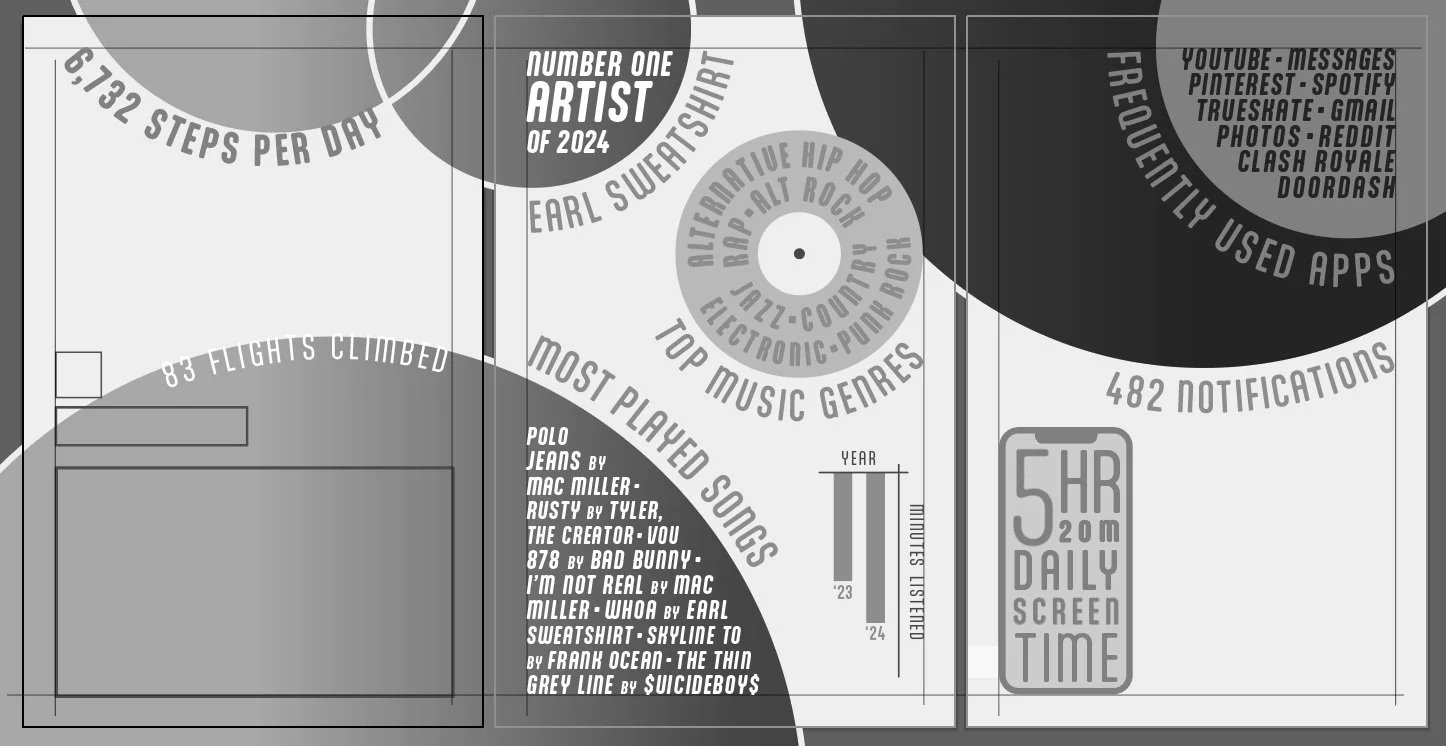
I made some adjustments to the colors and sizes of the graphics, and the layout was just about finished.
FONT CHOICE
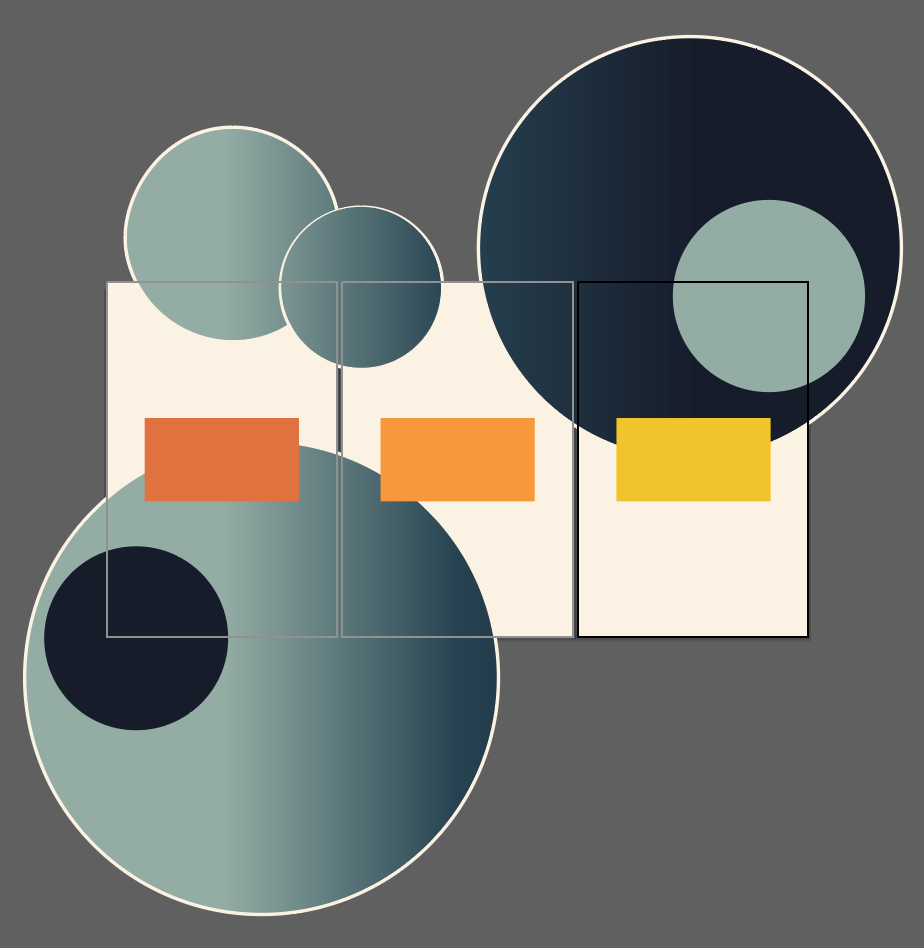
COLOR SCHEME

I searched for a sans-serif font family in order to maintain readability in a variety of type sizes. I chose Aptly, a soft-edged, geometric sans-serif, to pair with the overlapping circular shapes and heavy-stroke graphics.


MOVEMENT
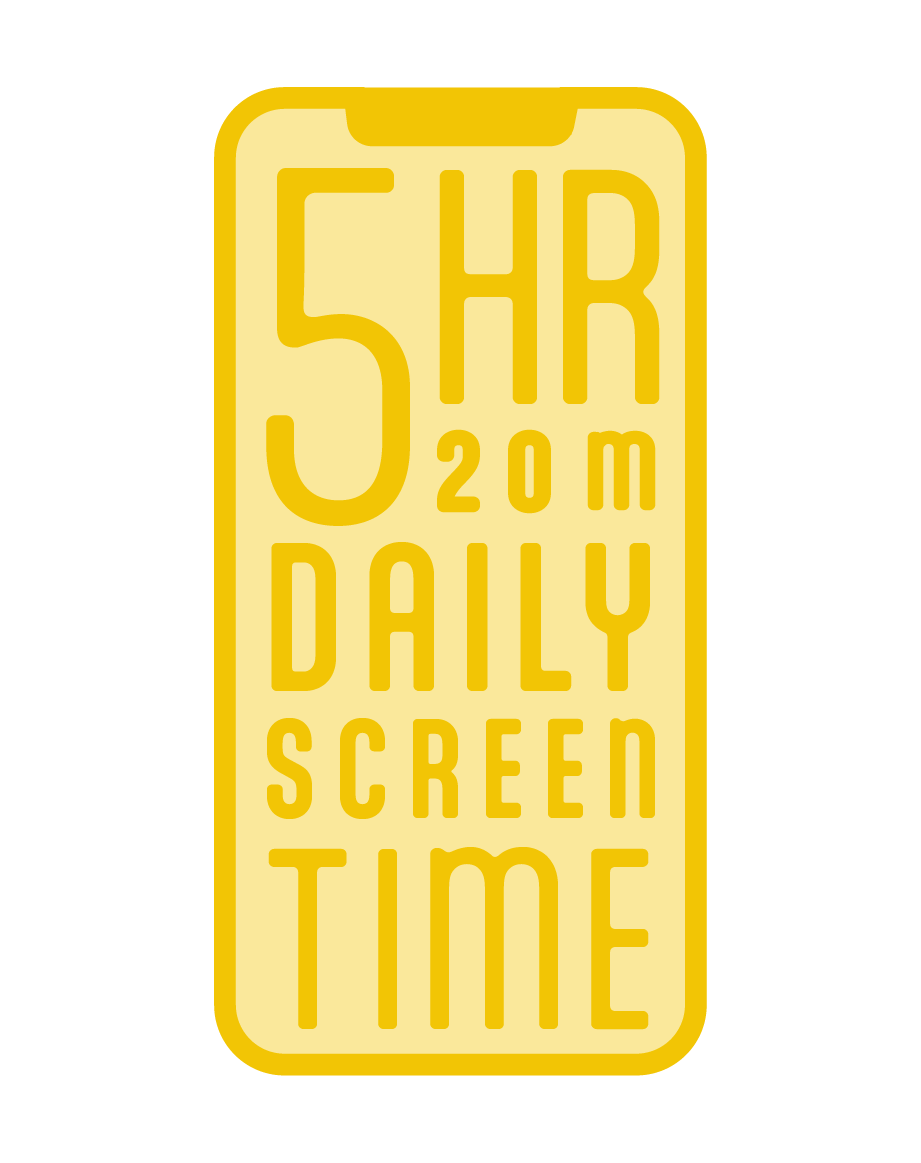
GRAPHICS AS TITLES
MUSIC
SCREEN TIME
This triptych was already text-heavy, so I decided to create three graphic icons to serve as quick descriptions of what each poster depicted instead of using text as titles.
FINAL GRAPHS


FINAL LAYOUT
